Feb 22, 2016 | Galaxy, Galaxy S7, Galaxy S7 edge, Image, Smart Phones, جالاكسي, سامسونج
كشفت شركة سامسونج اليوم عن أحدث الإضافات التابعة لسلسلة هواتف جالكسي، سامسونج جالكسي إس 7 Galaxy S7 وجالكسي إس 7 إيدج Galaxy S7 edge، وتأتي الهواتف بتصميم أنيق وأداء قوي إلى جانب ميزات الكاميرا المتقدمة وخاصية مقاومة الماء والذاكرة الخارجية.
وقال دي جي كوه، رئيس أعمال الاتصالات المتنقلة لدى شركة سامسونج للإلكترونيات: “نحن نؤمن بعالم أكثر إشراقاً وأكثر وضوحاً وأكثر ملاءمة وأكثر متعة، ونسعى جاهدين لتقديم رؤية جديدة عبر هاتفي Galaxy S7 و S7 Edge وذلك عبر التصميم الأنيق مع الوظائف والميزات المتعددة بالإضافة لتوفير تجربة محمول سلسة”. وأضاف: “نقدم للمستهلكين تقنيات تساعدهم في الحصول على المزيد من المنافع والمزايا، وسوف نستمر في دفع هذه الحدود إلى أبعد ما يمكن”.
كاميرا متقدمة: صور عالية الجودة بغض النظر عن الوقت أو الموقع
تقدم هواتف جالكسي الجديدة أول كاميرا مع بيكسل مزودج Dual Pixel في هاتف ذكي، بحيث تقدم صور أكثر إشراقاً وأكثر وضوحاً حتى في ظروف الإضاءة المنخفضة. ويتم ذلك بفضل التكنولوجيا الثورية لتقنية البيكسل المزدوج، والعدسة الأوضح ذات الفتحة الأوسع والبيكسل الأكبر، وتمتلك الكاميرا غالق أسرع وضبط تلقائي للصورة أكثر دقة حتى في ظروف الإضاءة المنخفضة. وتقدم الكاميرا الوضعية الجديدة Motion Panorama، والتي تجلب الحركة للصور البانورامية التقليدية، مما يتيح للمستخدم تجربة بصرية شاملة تماماً.
مفاهيم جديدة للتصميم والوظائف
يتكون تصميم هواتف الجديدة من الزجاج والمعدن، إلى جانب تصميم أنيق ومتين مع انحناءات هندسية توفر قبضة مريحة. وتتيح ميزة Always-On للمستخدمين تجربة مبسطة وسهلة الاستخدام بدون لمس الشاشة للحصول على التاريخ والوقت والتنبيهات دون عناء أو قلق حول فقدان مكالمة أو ملاحظات هامة. وتقدم هواتف جالاكسي إس 7 وإس 7 ايدج ميزة مقاومة الماء دون المساومة على تصميم الهواتف مع دعم معيار IP68 لمقاومة المياه والغبار.
ويوفر هاتف جالاكسي إس 7 ايدج تجربة متقدمة ومريحة مع زيادة كفاءة الاستخدام، وذلك من خلال إنشاء الاختصارات المهمة للمستخدم بسهولة أكبر، مثل البريد الإلكتروني، ووضع صورة شخصية، ووضع البانوراما، أو تطبيقات الطرف الثالث.
تعزيز الأداء: من الشحن إلى الألعاب
تقدم الهواتف الجديدة تقنية الشحن السلكية واللاسلكية السريعة، وتسمح علبة بطاقة الشريحة الهجينة للمستخدمين بإضافة بطاقة MicroSD يصل حجمها إلى 200 جيجابايت لتوفير مساحة تخزين إضافية، كما توفر هذه العلبة في بعض البلدان إمكانية استخدام بطاقتي سيم معاً.
كما قدمت سامسونج تحديثات مهمة لتحسين أداء الألعاب على الهواتف الجديدة، بحيث يسمح المعالج القوي والبطارية الأكبر بضمان وقت لعب أطول، ويحافظ نظام التبريد الداخلي للجهاز على الحفاظ عليه من ارتفاع درجة الحرارة.
وتشكل إضافة Game Launcher ميزة إضافية للاعبين بحيث تسمح لهم بإدارة استهلاك البطارية وتقليل التنبيهات، ويمكن للمستخدم تسجيل تجربة الألعاب الخاصة بهم أو مشاركة الشاشة الخاصة بالألعاب مع الآخرين، وتعطي واجهات التطبيقات البرمجية Vulkan API للمستخدمين القدرة على تشغيل الألعاب ذات الرسوميات العالية الأداء مع التقليل من استهلاك البطارية.
تجربة جالاكسي
تواصل سامسونج دفع حدود الأجهزة والبرمجيات والخدمات لتقديم أجهزة مصممة لتحسين كيفية ربط المستهلكين والمشاركة والتنظيم في سبيل الحصول على المزيد من الحياة، وتقوم الشركة بإعادة تعريف ما هو ممكن خارج حدود التكنولوجيا اليوم من خلال تقديم تجربة محمول سلسة.
وتسمح إمكانيات الربط السلس على وصل هواتف جالكسي إس 7 وجالكسي إس 7 ايدج بساعة Gear S2 Classic الجديدة لمراقبة أنشطة اللياقة البدنية، أو التوصيل مع نظارة الواقع الافتراضي Gear VR، بحيث تقوم سامسونج بإعادة تعريف ما هو ممكن ضمن تجربة المحمول وخارجها.
وبإمكان مستخدمي الهواتف الجديدة الحصول على خدمة دفع ممتازة بواسطة الهاتف المحمول عبر خدمة سامسونج باي Samsung Pay الآمنة والسهلة الاستخدام والتي تعمل في أي مكان تقريباً، والمحمية بواسطة KNOX وميزة قارئ بصمات الأصابع، والتي تعمل عبر تقنية الاتصال NFC وتقنية النقل المغناطيسي الآمن MST وتقنية الباركود، مما يجعل الدفع عبر الهاتف المتحرك في متناول مختلف الأشخاص.
وتتوفر الهواتف في الأسواق ابتداءً من منتصف شهر مارس القادم.
|
Galaxy S7 |
Galaxy S7 edge |
| نظام التشغيل |
أندرويد 6 مارشميلو |
أندرويد 6 مارشميلو |
| الشبكات |
LTE Cat.9 وWiFi 802.11 a/b/g/n/ac وMIMO وبلوتوث 4.2 وANT+ و USB 2.0و NFC |
LTE Cat.9 وWiFi 802.11 a/b/g/n/ac وMIMO وبلوتوث 4.2 وANT+ و USB 2.0و NFC |
| الأبعاد |
142.4×69.6×7.9 ميليمتر |
150.9×72.6×7.7 ميليمتر |
| الوزن |
152 جرام |
157 جرام |
| المعالج |
معالج ثماني النوى (٤ نوى بتردد ٢٫٣ جيجاهيرتز) + (٤ نوى بتردد ١٫٦ جيجاهيرتز)، ٦٤ بت، ١٤ نانومتر.
معالج رباعي النوى (٢ نواة بتردد ٢٫١٥ جيجاهيرتز) + (٢ نواة بتردد ١٫٦ جيجاهيرتز)، ٧٦ بت، ١٤ نانومتر. |
معالج ثماني النوى (٤ نوى بتردد ٢٫٣ جيجاهيرتز) + (٤ نوى بتردد ١٫٦ جيجاهيرتز)، ٦٤ بت، ١٤ نانومتر.
معالج رباعي النوى (٢ نواة بتردد ٢٫١٥ جيجاهيرتز) + (٢ نواة بتردد ١٫٦ جيجاهيرتز)، ٧٦ بت، ١٤ نانومتر. |
| ذاكرة الوصول العشوائي |
4 جيجابايت |
4 جيجابايت |
| مساحة التخزين الداخلية |
32 و64 جيجابايت مع وجود فتحة MicroSD |
32 و64 جيجابايت مع وجود فتحة MicroSD |
| الشاشة |
5.1 إنش بدقة 1440×2560 بيكسل وكثافة 577 بيكسل بالإنش من نوع Super AMOLED |
5.5 إنش بدقة 1440×2560 بيكسل وكثافة 534 بيكسل بالإنش من نوع Super AMOLED |
| الكاميرا الخلفية |
كاميرا خلفية محسنة بدقة 12 ميجابيكسل مع فتحة عدسة f/1.7 مع ميزة مثبت الصورة البصري وخاصية التركيز التلقائي للصورة وفلاش LED مزدوج |
كاميرا خلفية محسنة بدقة 12 ميجابيكسل مع فتحة عدسة f/1.7 مع ميزة مثبت الصورة البصري وخاصية التركيز التلقائي للصورة وفلاش LED مزدوج |
| الكاميرا الأمامية |
بدقة 5 ميجابيكسل |
بدقة 5 ميجابيكسل |
| البطارية |
3.000 ميلي أمبير تدعم خصائص الشحن السريع والشحن اللاسلكي والشحن اللاسلكي السريع |
3.600 ميلي أمبير تدعم خصائص الشحن السريع والشحن اللاسلكي والشحن اللاسلكي السريع |
Feb 22, 2016 | Alcatel, Alcatel Plus, Alcatel Plus 10, Image, Information Center, Technology, two in one, windows
ألكاتيل تعلن عن حاسبها الهجين Alcatel Plus 10 من فئة اثنان في واحد
Alcatel Plus 10
أعلنت شركة ألكاتيل اليوم عن حاسبها المحمول الهجين Alcatel Plus 10 من فئة إثنان في واحد العامل بنظام ويندوز 10 ويندوز مع لوحة مفاتيح قابلة للفصل والتي تقدم ميزة فريدة من نوعها بحيث تعتبر نقطة LTE ساخنة.
ويقدم الحاسب شاشة من نوع IPS LCD بقياس 10.1 إنش بدقة 1280×800 بيكسل تعمل باللمس بكثافة 149 بيكسل بالإنش، مع معالج Atom x5 Z8350 رباعي الأنوية من شركة إنتل بتردد 1.92 جيجاهيرتز.
ويحوي الجهاز على 2 جيجابايت من ذاكرة الوصول العشوائي إلى جانب 32 جيجابايت من مساحة التخزين الداخلية والتي يمكن زيادتها إلى 64 جيجابايت عبر بطاقة MicroSD.
كما قامت شركة ألكاتيل بتضمين الحاسب مكبرات صوت ستيريو على الجهة الأمامية، بالإضافة لوجود كاميرا أمامية للصور الشخصية بدقة 2 ميجابيكسل في الزاوية وكاميرا خلفية بدقة 5 ميجابيكسل.
ويضم الحاسب منافذ USB ومايكرو USB ومايكرو HDMI، وتأتي لوحة المفاتيح بالحجم الكامل وتقدم بنية اتصال مدمجة لتقنية LTE وتعمل بمثابة نقطة اتصال واي فاي تسمح باتصال 15 جهاز، ويتميز الحاسب بامكانيات اتصال مختلفة مثل البلوتوث 4.0 وWi-Fi b/g/n.
وتبلغ سعة بطارية الحاسب 5.830 ميلي أمبير، بينما تضم لوحة المفاتيح بطارية بسعة 2.850 ميلي أمبير، مما يوفر سعة 8.410 ميلي أمبير معاً، بحيث يعمل الجهاز لمدة تصل إلى 8 ساعات متواصلة.
وتم تصميم حاسب Alcatel Plus 10 من البلاستيك بشكل كامل على الرغم من أنه يظهر بانه من المعدن، ويتوفر ابتداءً من شهر يونيو في أسواق أوروبا وأمريكا اللاتينية والشرق الأوسط وافريقا، مع خيارات متعددة من ناحية الألوان.

Feb 17, 2016 | HDD, icons, Image, Learn and Teach, Mac, show icon on desktop
Show or Hide HDD icon on desktop of mac

You can easily hide or show the “Macintosh HD” main hard drive from the desktop of OS X, along with any other internal volumes and removable drives by adjusting some Finder options.
[ad id=”13280″]
If you like to keep your disk drives available on the desktop for easy access like this, here’s what you can do to be sure they’re always visible on the Mac desktop:
How to Show (or Hide) Hard Drives, Disks, and Volumes on the Mac OS X Desktop
This feature is available in all versions of OS X:
- Go to the desktop of the Mac if you haven’t yet
- Launch the Finder Preferences from the “Finder” menu, or hit Command+,
- Under the ‘General’ tab, check or uncheck items you either want shown or hidden, respectively
- Close Finder preferences
The settings look like the following:

These changes take effect immediately. Through these preferences you can adjust the visibility of Macintosh HD and other internal hard disks, external drives, CD’s, DVD’s, iPods, and even connected servers.
Macintosh HD is categorized under ‘Hard disks’ so if you leave it checked it will remain visible.
Each drive will have a unique icon visible on the desktop.

If you’re a minimalist or you just don’t like the desktop icons and the clutter they can cause, you can always hide all desktop icons in Mac OS X with a simple Terminal command as well.

Feb 10, 2016 | explore, hosts, Image, IP, kali, Learn and Teach, Linux, network, network ip, nmap, zenmap
Exploring Your Home Computer Network with Kali Linux
Exploring Your Home Computer Network with Kali Linux
This article is part two in our tutorial series on
how to set up a home hacking and security testing lab. If you followed along in part one,
installing a Kali Linux virtual machine in VirtualBox, you have installed VirtualBox on the primary computer for your home lab and created a Kali Linux virtual guest on this host machine. The Kali system has been fully updated and VirtualBox Guest Additions have been installed on it. Finally, your Kali VM has a single network adapter running in bridged mode and you have set up an administrator account on the Kali instance.
Creating and configuring the virtual network setup outlined in the introduction, which we will do in part three of this series, requires a few more steps: we still have to download and install Metasploitable, set up the virtual network, etc. But if you’re like me, you’re probably already itching to start playing with all the toys Kali has to offer, if you haven’t already!
Home Network Analysis 101
This article will show how some of the tools that come bundled in Kali can be used to explore your existing home computer network, and test whether you can successfully identify all the devices that are connected to it. In particular, we’ll take a look at a set of tools that come bundled in Kali that can be used for network analysis: nmap/Zenmap and dumpcap/Wireshark.
These will come in handy in our eventual testing lab, but they can obviously also be used to explore your home local area network as well. Nmap is a command line network scanner, and Zenmap is a graphical interface to nmap. Dumpcap is a command line network traffic monitor, and Wireshark provides a powerful and versatile graphical interface to monitor network traffic and analyze network packet capture files.
Here’s a simple experiment. Do you happen to know how many devices are currently connected to your home network? Can you identify all of them off the top of your head? Try to do so, and make a list of them. At the very least, we know there will be at least three: the Kali guest, the host machine you are running Kali on, and your router. There may also be more computers or cell phones connected to it, and maybe even your television, refrigerator or coffee maker!
We are first going to use nmap to see if we can identify any such devices on the network, and perhaps detect one or two that we did not think or know were connected to it. We’ll then configure Wireshark and run a packet captures to get a sense for the normal traffic on the network, and then run another capture to analyze just how an nmap network scan works.
Determining Your IP Address
Before we can scan the network with nmap, we need to identify the ip address range we would like to examine. There are a number of different ways to determine your ip address on a Linux distribution such as Kali. You could use, for example, the ip or ifconfig commands in a terminal: ip addr, or sudo ifconfig.
(Note that if you are using an administrator account inside Kali, which is considered a best practice, when a non-root user enters a command such as ifconfig into a terminal, the shell will likely respond by complaining “command not found”. In Kali, sensitive system commands like ifconfig have to be run as root. To access it from your administrator account, all you need to do is add “sudo” to the front of the command: sudo ifconfig.)
These commands will provide you will a wealth of information about your network interfaces. Identify the interface that is connected to the LAN (likely eth0), and make a note of the ip address indicated after “inet” for the ip addr command, or after “int addr:” for the ifconfig command. That is your ip address on your local area network. Here are a couple ifconfig and ip addr outputs posted by the Ubuntu Journeyman:
As you can see here, the ip address for this machine is 192.168.1.4.5. Yours is likely something similar to this: for example, 192.168.1.123 or 10.0.0.56 etc. Notice in the ip addr output above, the ip address is: 192.168.4.5/24. That means 192.168.4.5 is the ip address of that specific machine, while the /24 at the end indicates the address space for the LAN’s subnet, which in this case are all the addresses from 192.168.4.1 to 192.168.4.255.
If we were to scan this local area network with nmap, we would want to scope out all the addresses in the network’s range, which means 192.168.4.1, 192.168.4.2, 192.168.4.3, 192.168.4.4, and so on, all the way to 192.168.4.255. One shorthand way of notating this is: 192.168.4.1-255. Another common shorthand is 192.168.4.0/24. Of course, if your address were 10.0.0.121, then the shorthand would be: 10.0.0.1-255 or 10.0.0.0/24.
Host Discovery
Let’s assume your Kali VM has the ip address 192.168.1.5 on a subnet with possible host addresses from 192.168.1.1 to 192.168.1.255. Now that we know Kali’s ip address and the address range we want to take a look at, open up a terminal and type: nmap. This will provide you with a long list of all the options available within the nmap program. Nmap is a powerful program and there are a lot of options! Perhaps the simplest possible network scan that can be conducted with nmap is a ping scan, for which we use the -sn option.
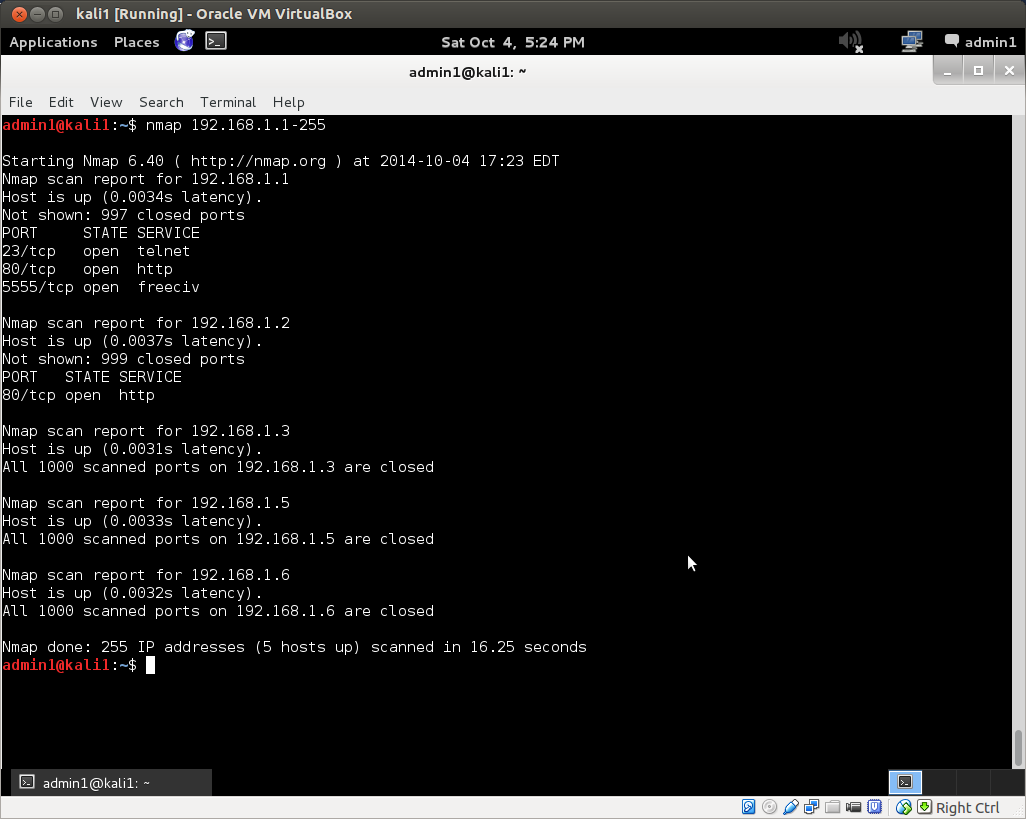
Now type nmap -sn 192.168.1.1-255 into your terminal and hit enter. (Don’t forget to substitute the address range for your network if it is different from this!) This scan will tell you how many hosts nmap discovered by sending a ping echo request to each of the addresses in the range x.x.x.1-255, and provide you with a list of the ip addresses of the hosts that returned a ping reply. This is host discovery 101. Here is the ping scan output from nmap on a simple local area network I set up for the purpose:
The ping scan found 5 hosts up with the addresses: 192.168.1.1, .2, .3, .5 and .6. Note that in the wild, this method of discovery may not work, as it is becoming increasingly common for administrators to configure their systems so that they do not reply to simple ping echo requests, leaving a would-be ping scanner none-the-wiser about their existence.
Did your scan find the same number of hosts that you had presumed were on your network? Were there more or less?
We can use the default nmap scan to further investigate known hosts and any potential ghost hosts the ping scan may or may not have uncovered. For this, simply remove the -sn option from the command above: nmap 192.168.1-255. Here’s the output of the default nmap scan on the same network as above:
Nmap has returned much more information. It found three open ports on the router at 192.168.1.1, as well as an open web server port on host 192.168.1.2. All scanned ports on the remaining hosts were closed.
You can also use nmap to further investigate known hosts. The -A option in nmap enables operating system detection and version detection. Pick out a couple of the hosts discovered by your nmap scans, for which you already know the operating system type and version. Now scan these hosts with nmap for OS and verstion detection by adding them to your host address target list, separated by commas. For example, if I would scan the router and web server discovered above for OS and version detection with the command: nmap -A 192.168.1.1,2. This will return more information, if any is determined, on those hosts.
You can obviously also run an OS and version detection scan over the whole network with the command: nmap -A 192.168.1.1-255. Depending on the number of hosts on your network, this scan could take a couple minutes to complete. If you press <Enter> while the scan is running, it will give you an update on its progress.
If there are more and a handful of hosts on your network, the output can be hard to parse in the terminal. You could send the output to a file with: nmap -A 192.168.1.1-255 > fileName.txt. Or you could use one of nmap’s own built-in file output options.
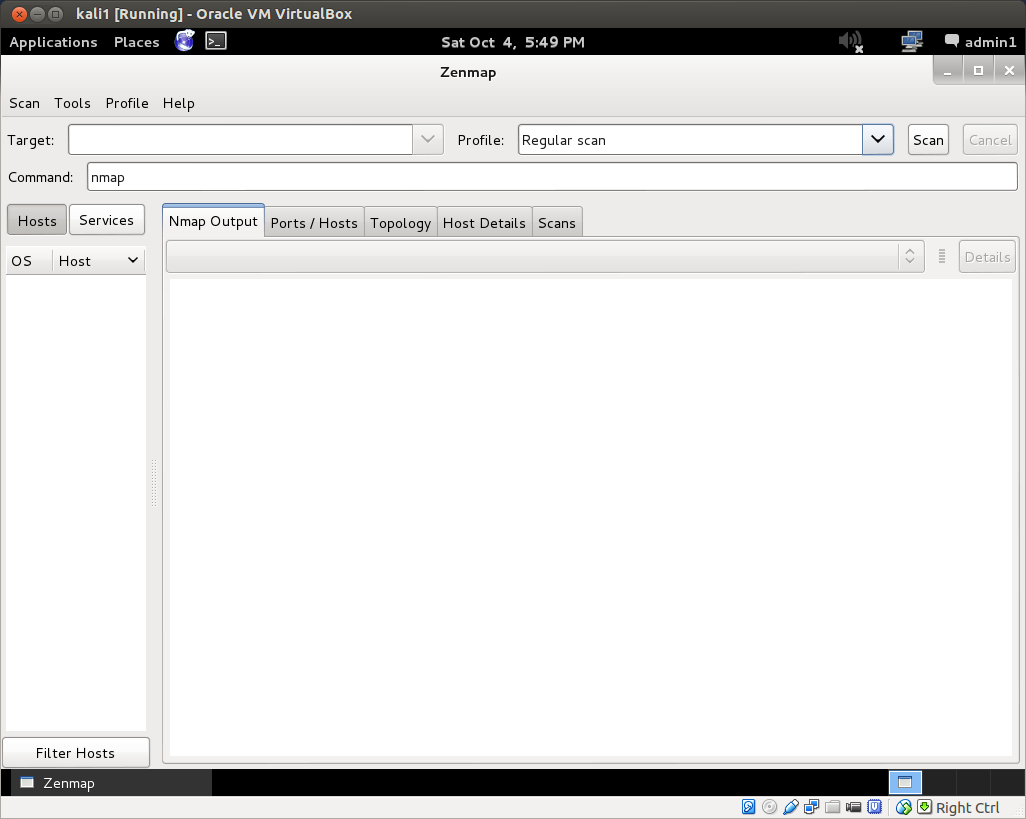
But this is also where Zenmap comes in quite handy. Open up Zenmap from Applications->Kali Linux->Information Gathering->Network Scanners. If you are running as an administrator and not root, as you should be, you will get a message stating that not all of nmap’s functionality can be accessed without root privileges. Root is not necessary for basic scans. However, you can run Zenmap as root by opening a terminal and typing: sudo zenmap. The Zenmap interface:
The Zenmap interface is pretty straightforward. Enter the target ip address or address range into the target field. Changing the scan profile from the drop down menu changes the scan command. You can also manually enter or edit commands in the command field. After you run a scan, Zenmap also helpfully breaks down the results for you, providing host details, port lists, network topology graphics and more.
Play around with the various built-in scan types. Can you identify all the hosts on your home network with a ping scan? a regular scan? an intense scan? Can you identify all the open ports on those hosts? If you have a laptop or another device that you frequently use to connect to the internet over public wi-fi hotspots, you can also do intensive scans of those devices to determine if there are any open ports that would represent a potential security vulnerability. Identifying open ports is important for vulnerability assessment, because these represent potential reconnaissance or attack vectors.
Network Traffic Capture and Analysis with Wireshark
Nmap scans a network and probes hosts by sending out ip packets to, and inspecting the replies from, its target at a given address. With 255 addresses to scan along with 1000 ports on all discovered hosts in the default scan of the subnet above, that’s a lot of network traffic! What does the packet traffic generated by a scan look like on the network?
To answer this question, we can use Wireshark and dumpcap. Dumpcap, as its name implies, is a command line tool that dumps captured network traffic. Wireshark provides a graphical user interface to analyze these sorts of dump files, which are collections of all the network traffic to which the given network interface was privy.
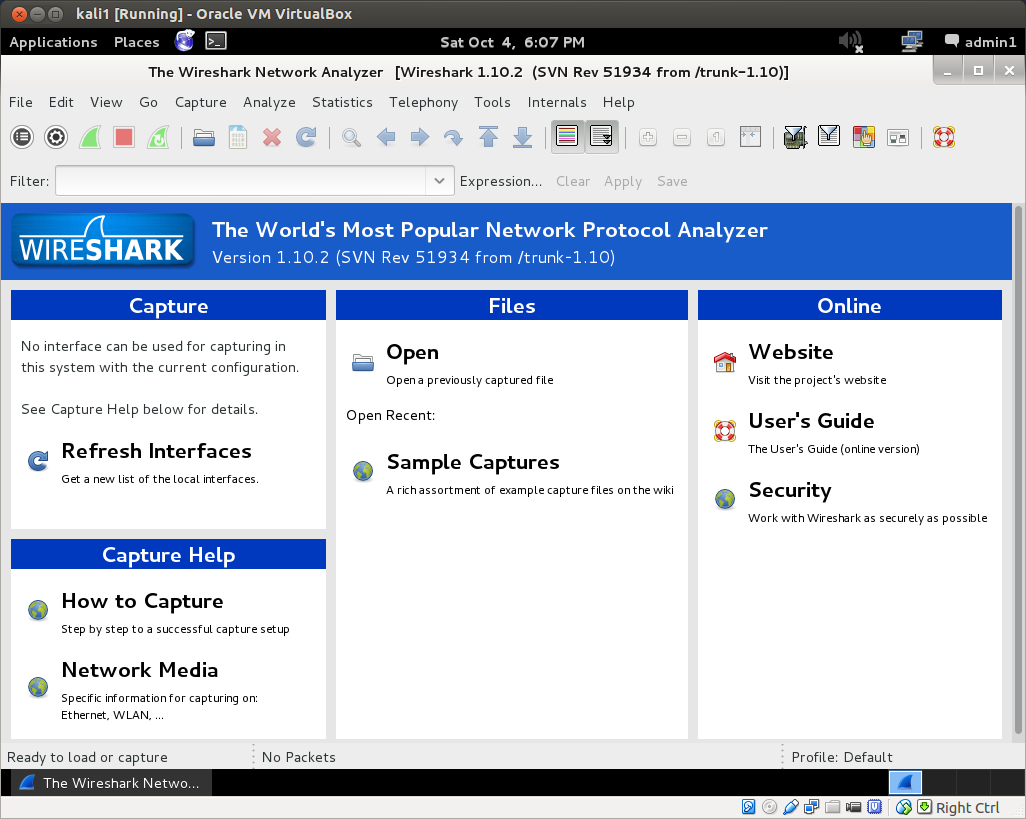
If run with the proper privileges, Wireshark can capture live network traffic as well. In Kali, you can find Wireshark under: Applications->Kali Linux->Top 10 Security Tools. Unless you have already configured Wireshark with the appropriate settings, when you open it for the first time you will be informed by the “Capture” panel that “No interface can be used for capturing in this system with the current configuration.”
In its documentation, Wireshark recommends appropriate settings to enable capture privileges. This also suggests confirming that Wireshark can also be run as root. To run Wireshark as root, you can log in as root, or run sudo wireshark in a terminal. When you run Wireshark as root, you will first be given a usage warning and provided with sources for how to set up proper privileges. This forum post on AskUbuntu boils the process down to three simple steps.
Now that you’ve enabled live captures in Wireshark, let’s run one! Click “Interface List” in the Capture panel of the default view. Choose the interface that is connected to the network (it will indicate your ip address on that network), and click Start.
This will immediately begin a live capture of all the packets on the network to which the interface has access. At the very least, it will detect: 1) packets it sends out, 2) packets it receives directly, 3) packets it receives indirectly if they are broadcast to all the hosts on the network.
If you have never viewed a network packet capture before, you may be surprised what you can see, and what information is simply being broadcast over the network. You’ll probably find messages from your router, you’ll see internet traffic packets if you are viewing a webpage in a Kali browser, or on Kali’s host computer (depending on whether or not Promiscuous Mode is enabled in the VirtualBox advanced network settings for your Kali machine). You might find that one device is especially chatty for no good reason. There might be devices pathetically sending out calls to other devices that have been removed from the network, such as a laptop searching for a printer that has been turned off, and so on.
The default Wireshark packet capture interface numbers each packet it captures, and then notes the time after the capture began that it received the packet, the ip address of the source of the packet, the ip address of the destination of the packet, the protocol, the packet’s length and some info. You can double click an individual packet to inspect it more closely.
If you ping your router (which you should have been able to identify via nmap analysis) from Kali, you’ll see all the requests and replies, obviously, since the Wireshark capture and the ping are running on the same machine. But the Kali guest shares its interface with the host machine. If you enable promiscuous mode in the advanced network settings inside VirtualBox for your Kali instance, when you ping your router from the host machine itself, the Wireshark capture will similarly allow you to see all requests and replies, they’re going over the same interface! If you disable Promiscuous Mode, on this other hand, this will not be the case. In this case, packets to and from the host computer will not be picked up, as if it were a completely separate physical machine. Similarly, if you ping your router from a different computer, you will not see the request/reply traffic at all, though perhaps you might pick up an ARP if the requester does not already know the (hardware) address of the request’s intended recipient.
After getting a feel for what the base level network traffic looks like on your network, start a new capture, and then run a simple scan from nmap or Zenmap, and watch the result in Wireshark. When the scan is finished, stop the capture and save the file. Capturing the simple nmap ping scan from above on my network resulted in a file with over 800 packets! Now you can analyze the network traffic generated by the scan itself. You’ll probably want to play around with Wireshark for a bit to get a sense of what it offers. There are tons of menus and options in Wireshark that can be tweaked and optimized for your own ends.
Well, that’s it for this article. In part three of our hack lab tutorial series, we’ll install our victim machine, an instance of Metasploitable2, in VirtualBox and set up a completely virtual lab network to explore some more tools that are bundled in Kali. As always, comments, questions, corrections and the like are welcome below.
Feb 8, 2016 | ccna, EIGRP, EIGRP Questions 4, exam, Image, Learn and Teach, test
EIGRP Questions 4
Question 1
Which three statements are true about EIGRP route summarization? (Choose three)
A. Manual route summarization is configured in router configuration mode when the router is configured for EIGRP routing.
B. Manual route summarization is configured on the interface.
C. When manual summarization is configured, the summary route will use the metric of the largest specific metric of the summary routes.
D. The ip summary-address eigrp command generates a default route with an administrative distance of 90.
E. The ip summary-address eigrp command generates a default route with an administrative distance of 5.
F. When manual summarization is configured, the router immediately creates a route that points to null0 interface
Answer: B E F
[accordions handle=”arrows” space=”yes” icon_color=”#3c7206″ icon_current_color=”#ffffff”]
[accordion title=”Explaination” ][/accordion]
Explanation
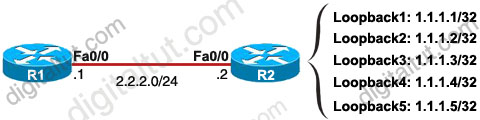
The ip summary-address eigrp {AS number} {address mask} command is used to configure a summary aggregate address for a specified interface. For example with the topology below:

R2 has 5 loopback interfaces but instead of advertising all these interfaces we can only advertise its summarized subnet. In this case the best summarized subnet should be 1.1.1.0/29 which includes all these 5 loopback interfaces.
R2(config)#interface fa0/0
R2(config-if)#ip summary-address eigrp 1 1.1.1.0 255.255.255.248
This configuration causes EIGRP to summarize network 1.1.1.0 and sends out Fa0/0 interface
After configuring manual EIGRP summary, the routing table of the local router will have a route to Null0:
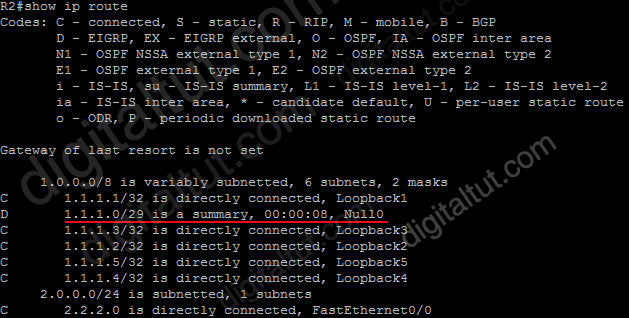
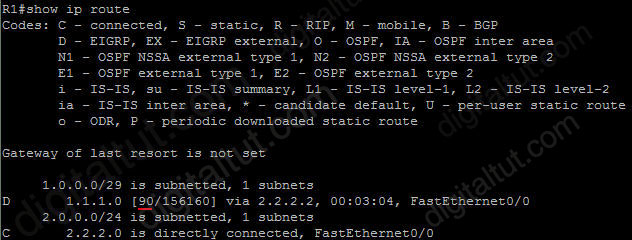
So why is this route inserted in the routing table when doing summarization? Well, you may notice that although our summarized subnet is 1.1.1.0/29 but we don’t have all IP addresses in this subnet. Assignable IP addresses of subnet 1.1.1.0/29 are from 1.1.1.1 to 1.1.1.6. Imagine what happens if R1 sends a packet to 1.1.1.6. Because R1 do believe R2 is connected with this IP so it will send this packet to R2. But R2 does not have this IP so if R2 has a default-route to R1 (for example R1 is connected to the Internet and R2 routes all unknown destination IP packets to R1) then a loop will occur.
To solve this problem, some routing protocols automatically add a route to Null0. A packet is sent to “Null0” means that packet is dropped. Suppose that R1 sends a packet to 1.1.1.6 through R2, even R2 does not have a specific route for that IP, it does have a general route pointing to Null0 which the packet sent to 1.1.1.6 can be matched -> That packet is dropped at R2 without causing a routing loop!
By default, EIGRP summary routes are given an administrative distance value of 5. Notice that this value is only shown on the local router doing the summarization. On other routers we can still see an administrative distance of 90 in their routing table.
[/accordions]
Question 2
After implementing EIGRP on your network, you issue the show ip eigrp traffic command on router C. The following output is shown:
RouterC#show ip eigrp traffic
IF-EIGRP Traffic Statistics for process 1
Hellos sent/received: 481/444
Updates sent/received: 41/32
Queries sent/received: 5/1
Replies sent/received: 1/4
Acks sent/received: 21/25
Input queue high water mark 2, 0 drops
SIA-Queries sent/received: 0/0
SIA-Replies sent/received: 0/0
Approximately 25 minutes later, you issue the same command again. The following output is shown:
RouterC#show ip eigrp traffic
IP-EIGRP Traffic Statistics for process 1
Hellos sent/received: 1057/1020
Updates sent/received: 41/32
Queries sent/received: 5/1
Replies sent/received: 1/4
Acks sent/received: 21/25
Input queue high water mark 2, 0 drops
SIA-Queries sent/received: 0/0
SIA-Replies sent/received: 0/0
Approximately 25 minutes later, you issue the same command a third time. The following output is shown:
RouterC#show ip eigrp traffic
IP-EIGRP Traffic Statistics for process 1
Hellos sent/received: 1754/1717
Updates sent/received: 41/32
Queries sent/received: 5/1
Replies sent/received: 1/4
Acks sent/received: 21/25
Input queue high water mark 2, 0 drops
SIA-Queries sent/received: 0/0
SIA-Replies sent/received: 0/0
What can you conclude about this network?
A. The network has been stable for at least the last 45 minutes.
B. There is a flapping link or interface, and router C knows an alternate path to the network.
C. There is a flapping link or interface, and router A does not know an alternate path to the network.
D. EIGRP is not working correctly on router C.
E. There is not enough information to make a determination.
Answer: A
[accordions handle=”arrows” space=”yes” icon_color=”#3c7206″ icon_current_color=”#ffffff”]
[accordion title=”Explaination” ]
Explanation
In three times using the command, the “Queries sent/received” & “Replies sent/received” are still the same -> the network is stable.
[/accordion]
[/accordions]
Question 3
After implementing EIGRP on your network, you issue the show ip eigrp traffic command on router C. The following output is shown:
RouterC#show ip eigrp traffic
IP-EIGRP Traffic Statistics for process 1
Hellos sent/received: 2112/2076
Updates sent/received: 47/38
Queries sent/received: 5/3
Replies sent/received: 3/4
Acks sent/received: 29/33
Input queue high water mark 2, 0 drops
SIA-Queries sent/received: 0/0
SIA-Replies sent/received: 0/0
Moments later, you issue the same command a second time and the following output is shown:
RouterC#show ip eigrp traffic
IP-EIGRP Traffic Statistics for process 1
Hellos sent/received: 2139/2104
Updates sent/received: 50/39
Queries sent/received: 5/4
Replies sent/received: 4/4
Acks sent/received: 31/37
Input queue high water mark 2, 0 drops
SIA-Queries sent/received: 0/0
SIA-Replies sent/received: 0/0
Moments later, you issue the same command a third time and the following output is shown:
RouterC#show ip eigrp traffic
IP-EIGRP Traffic Statistics for process 1
Hellos sent/received: 2162/2126
Updates sent/received: 53/42
Queries sent/received: 5/5
Replies sent/received: 5/4
Acks sent/received: 35/41
Input queue high water mark 2, 0 drops
SIA-Queries sent/received: 0/0
SIA-Replies sent/received: 0/0
What information can you determine about this network?
A. The network is stable.
B. There is a flapping link or interface, and router C knows an alternate path to the network.
C. There is a flapping link or interface, and router C does not know an alternate path to the network.
D. EIGRP is not working correctly on router C.
E. There is not enough information to make a determination.
Answer: B
[accordions handle=”arrows” space=”yes” icon_color=”#3c7206″ icon_current_color=”#ffffff”]
[accordion title=”Explaination” ]
Explanation
We notice that the “Queries received” number is increased so router C has been asked for a route. The “Replies sent” number is also increased -> router C knows an alternate path to the network.
[/accordion]
[/accordions]
Question 4
R1 and R2 are connected and are running EIGRP on all their interfaces, R1 has four interfaces, with IP address 172.16.1.1/24, 172.16.2.3/24,172.16.5.1/24, and 10.1.1.1/24. R2 has two interfaces, with IP address 172.16.1.2/24 and 192.168.1.1/24. There are other routers in the network that are connected on each of the interfaces of these two routers that are also running EIGRP. Which summary routes does R1 generate automatically (assuming auto-summarization is enable)? (choose two)
A. 192.168.1.0/24
B. 10.0.0.0/8
C. 172.16.1.0/22
D. 172.16.0.0/16
E. 10.1.1.0/24
Answer: B D
Question 5
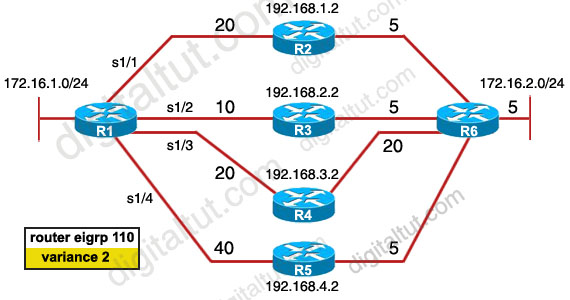
There was an exhibit, 172.16.1.0/24 to 172.16.2.0/24 with the 4 paths with mentions of eigrp metric and asked if the variance is put to 2 in exhibit then what 2 paths are not used by eigrp routing table? (Choose two)
A. R1—R2—R6
B. R1—R3—R6
C. R1—R4—R6
D. R1—R5—R6
Answer: C D
Question 6
What does the default value of the EIGRP variance command of 1 mean?
A. Load balancing is disabled on this router.
B. The router performs equal-cost load balancing.
C. Only the path that is the feasible successor should be used.
D. The router only performs equal-cost load balancing on all paths that have a metric greater than 1.
Answer: B
Question 7
Refer to the exhibit. EIGRP has been configured on all routers in the network. The command metric weights 0 0 1 0 0 has been added to the EIGRP process so that only the delay metric is used in the path calculations. Which router will R1 select as the successor and feasible successor for Network A?
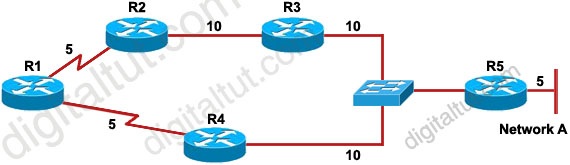
A. R4 becomes the successor for Network A and will be placed in the routing table. R2 becomes the feasible successor for Network A.
B. R4 becomes the successor for Network A and will be included in the routing table. No feasible successor will be selected as the advertised distance from R2 is higher than the feasible distance.
C. R2 becomes the successor and will be placed in the routing table. R4 becomes the feasible successor for Network A.
D. R2 becomes the successor and will be placed in the routing table. No feasible successor will be selected as the reported distance from R4 is lower than the feasible distance.
Answer: B
Question 8
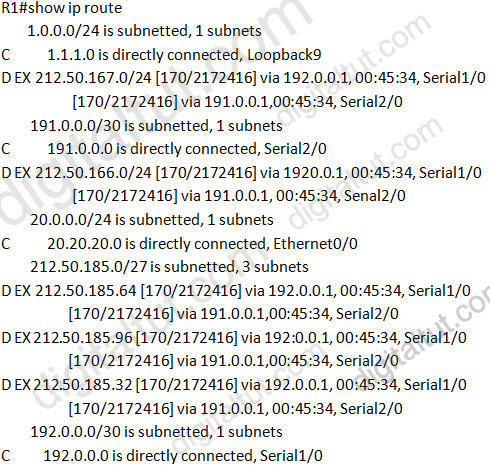
Based on the exhibited output, which three statements are true? (Choose three)
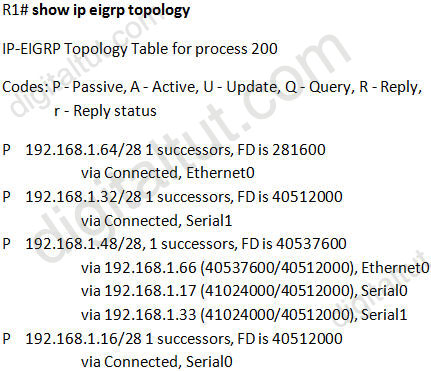
A. R1 is in AS 200.
B. R1 will load balance between three paths to reach the 192.168.1.48/28 prefix because all three paths have the same advertised distance (AD) of 40512000.
C. The best path for R1 to reach the 192.168.1.48/28 prefix is via 192.168.1.66.
D. 40512000 is the advertised distance (AD) via 192.168.1.66 to reach the 192.168.1.48/28 prefix.
E. All the routes are in the passive mode because these routes are in the hold-down state.
F. All the routes are in the passive mode because R1 is in the query process for those routes.
Answer: A C D
[accordions handle=”arrows” space=”yes” icon_color=”#3c7206″ icon_current_color=”#ffffff”]
[accordion title=”Explaination” ]
Explanation
In the statement “IP-EIGRP Topology Table for process 200”, process 200 here means AS 200 -> A is correct.
There are 3 paths to reach network 192.168.1.48/28 but there is only 1 path in the routing table (because there is only 1 successor) so the path with least FD will be chosen -> path via 192.168.1.66 with a FD of 40537600 will be chosen -> C is correct.
The other parameter, 40512000, is the AD of that route -> D is correct.
[/accordion]
[/accordions]
Question 9
Characteristics of the routing protocol EIGRP? (choose two)
A. Updates are sent as broadcast.
B. Updates are sent as multicast.
C. LSAs are sent to adjacent neighbors.
D. Metric values are represented in a 32-bit format for granularity.
Answer: B D
[accordions handle=”arrows” space=”yes” icon_color=”#3c7206″ icon_current_color=”#ffffff”]
[accordion title=”Explaination” ]
Explanation
EIGRP updates are sent as multicast to address 224.0.0.10 -> B is correct.
EIGRP metric values, for example an entry in the “show ip route” command:
D 10.1.21.128/27 [90/156160] via 10.1.4.5, 00:00:21, FastEthernet1/0/1
EIGRP metric here is 156160 and it is a 32-bit value. For more information please read here:
http://www.cisco.com/c/en/us/products/collateral/ios-nx-os-software/enhanced-interior-gateway-routing-protocol-eigrp/whitepaper_C11-720525.html
[/accordion]
[/accordions]
Question 10
Which EIGRP packet statement is true?
A. On high-speed links, hello packets are broadcast every 5 seconds for neighbor discovery.
B. On low-speed links, hello packets are broadcast every 15 seconds for neighbor discovery.
C. Reply packets are multicast to IP address 224.0.0.10 using RTP.
D. Update packets route reliable change information only to the affected routers.
E. Reply packets are used to send routing updates.
Answer: D
Feb 8, 2016 | ccna, EIGRP, EIGRP Questions 3, exam, Image, Learn and Teach, Quiz, test
Here you will find answers to EIGRP Questions – Part 3
Note: If you are not sure about EIGRP, please read my EIGRP tutorial.
Question 1
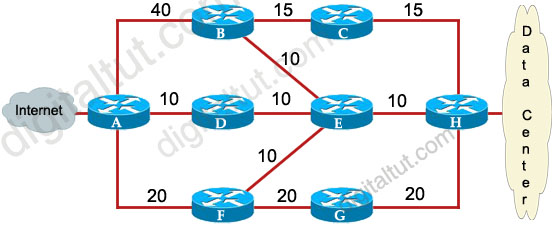
Refer to the exhibit. ROUTE.com has just implemented this EIGRP network. A network administrator came to you for advice while trying to implement load balancing across part of their EIGRP network.
If the variance value is configured as 2 on all routers and all other metric and K values are configured to their default values, traffic from the Internet to the data center will be load balanced across how many paths?

A. 1
B. 2
C. 3
D. 4
Answer: C
Explanation
First we should list all the paths from the Internet to the data center:
+ A-B-C-H with a metric of 70 (40 + 15 + 15)
+ A-B-E-H with a metric of 60 (40+10+10)
+ A-D-E-H with a metric of 30 (10+10+10)
+ A-D-E-B-C-H with a metric of 60 (10+10+10+15+15)
+ A-D-E-F-G-H with a metric of 70 (10+10+10+20+20)
+ A-F-G-H with a metric of 60 (20+20+20)
+ A-F-E-H with a metric of 40 (20+10+10)
So the path A-D-E-H will be chosen because it has the best metric. But EIGRP can support unequal cost path load balancing. By configuring the variance value of 2, the minimum metric is increased to 60 (30 * 2) and all the routes that have a metric of less than or equal to 60 and satisfy the feasibility condition will be used to send traffic.
Besides the main path A-D-E-H we have 4 more paths that have the metric of less than or equal to 60 (we also include the Advertised Distances of these routes for later comparison):
+ A-B-E-H with an AD of 20
+ A-D-E-B-C-H with an AD of 50
+ A-F-G-H with an AD of 40
+ A-F-E-H with an AD of 20
Now the last thing we need to consider is the feasible condition. The feasible condition states:
“To qualify as a feasible successor, a router must have an AD less than the FD of the current successor route”
The FD of the current successor route here is 30 (notice that the variance number is not calculated here). Therefore there are only 2 paths that can satisfy this conditions: the path A-B-E-H & A-F-E-H.
In conclusion, traffic from the Internet to the data center will be load balanced across 3 paths, including the main path (successor path) -> C is correct.
Question 2
Which condition must be satisfied before an EIGRP neighbor can be considered a feasible successor?
A. The neighbor’s advertised distance must be less than or equal to the feasible distance of the current successor.
B. The neighbor’s advertised distance must be less than the feasible distance of the current successor.
C. The neighbor’s advertised distance must be greater than the feasible distance of the current successor.
D. The neighbor’s advertised distance must be equal to the feasible distance of the current successor.
E. The neighbor’s advertised distance must be greater than or equal to the feasible distance of the current successor.
Answer: B
Explanation
As explained in question 1, this is called the feasible condition.
Question 3
Which statement about a non-zero value for the load metric (k2) for EIGRP is true?
A. A change in the load on an interface will cause EIGRP to recalculate the routing metrics and send a corresponding update out to each of its neighbors.
B. EIGRP calculates interface load as a 5-minute exponentially weighted average that is updated every 5 minutes.
C. EIGRP considers the load of an interface only when sending an update for some other reason.
D. A change in the load on an interface will cause EIGRP to recalculate and update the administrative distance for all routes learned on that interface.
Answer: C
Explanation
The load metric (k2) represents the worst load on a link between source and destination.
EIGRP routing updates are triggered only by a change in network topology (like links, interfaces go up/down, router added/removed), and not by change in interface load or reliability -> A & D are not correct.
The load is a five minute exponentially weighted average that is updated every five seconds (not five minutes) -> B is not correct.
EIGRP considers the load of an interface only when sending an update for some other reason (like a link failure, topology change). Updates are not sent out each time the load changes -> C is correct.
Note: To learn how to calculate EIGRP metric, please read my EIGRP tutorial – Part 3.
Question 4
Your network consists of a large hub-and-spoke Frame Relay network with a CIR of 56 kb/s for each spoke.
Which statement about the selection of a dynamic protocol is true?
A. EIGRP would be appropriate if LMI type ANSI is NOT used.
B. EIGRP would be appropriate, because the Frame Relay spokes could be segmented into their own areas.
C. EIGRP would be appropriate, because by default, queries are not propagated across the slow speed Frame Relay links.
D. EIGRP would be appropriate, because you can manage how much bandwidth is consumed over the Frame Relay interface.
Answer: D
Explanation
By default, EIGRP will limit itself to using no more than 50% of the interface bandwidth. The primary benefit of controlling EIGRP’s bandwidth usage is to avoid losing EIGRP packets, which could occur when EIGRP generates data faster than the interface line can absorb it. This is of particular benefit on Frame Relay networks, where the access interface bandwidth and the PVC capacity may be very different.
For example, in our Frame Relay topology a Hub is connected with 4 Spoke routers. The main Frame Relay interface on Hub router is 512Kpbs which is not enough to use for 6 links of 128 Kbps ( = 768 Kbps).
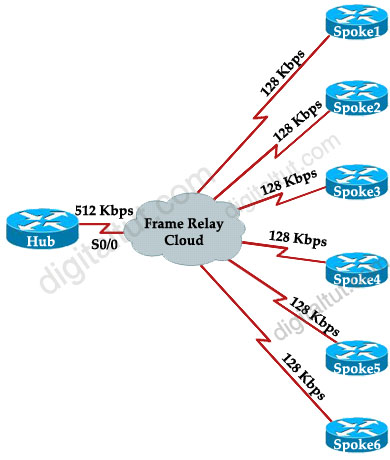
The solution here is we can use 512 / 6 = 85 Kbps on each subinterface of Hub by using “bandwidth 85” command. For example:
Hub(config)#interface Serial0/0.1 point-to-point
Hub(config-subif)#bandwidth 85
Also on Spoke routers we need to set this value. For example on Spoke1:
Spoke1(config)#interface Serial0/1.0 point-to-point
Spoke1(config-subif)#bandwidth 85
Notice that by default, EIGRP limits itself to use no more than 50% of the configured interface bandwidth. In this case EIGRP will not use more than 42.5 Kbps (50% of 85 Kbps).
(For more information about implementing EIGRP over Frame Relay, please read http://www.cisco.com/en/US/tech/tk365/technologies_tech_note09186a0080094063.shtml)
Question 5
When an EIGRP topology change is detected, what is the correct order of events when there is a FS?
A.
The neighbor adjacency is deleted.
The feasible route is used.
DUAL is notified.
Remove all topology entries learned from that neighbor.
B.
DUAL is notified.
Remove all topology entries learned from that neighbor.
The neighbor adjacency is deleted.
Routes enter the Active state and the feasible route is used.
C.
The neighbor adjacency is deleted.
Routes enter the Active state and the feasible route is used.
DUAL is notified.
Remove all topology entries learned from that neighbor.
D.
DUAL is notified.
The neighbor adjacency is deleted.
Remove all topology entries learned from that neighbor.
The feasible route is used.
Answer: D
Question 6
Refer to the exhibit. You want to use all the routes in the EIGRP topology for IP load balancing.
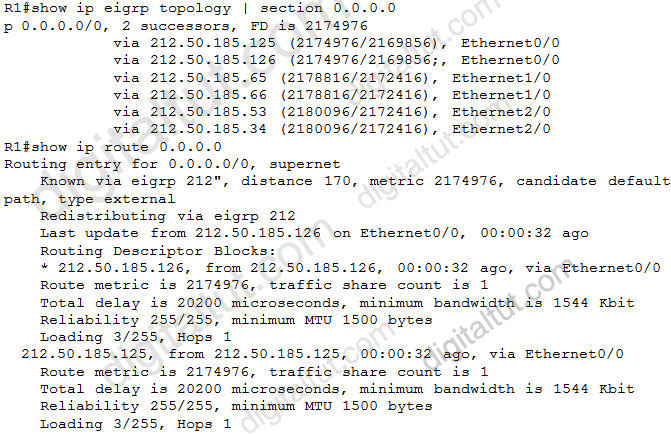
Which two EIGRP subcommands would you use to accomplish this goal? (Choose two)
A. traffic-share balanced
B. distance
C. maximum-paths
D. default-network
E. variance
Answer: C E
Explanation
Notice that the “maximum-paths” command is used to share traffic to equal cost path while the “variance” command can share traffic to unequal cost path.
In the output above we learn that EIGRP is using 2 successors to send traffic. By using the “variance 2” command we can share traffic to other feasible successor routes. But by default, EIGRP only shares traffic to 4 paths. So we need to use the “maximum-paths 6” to make sure all of these routes are used.
Question 7
Refer to the exhibit. R1 accesses the Internet using E0/0. You have been asked to configure R1 so that a default route is generated to its downstream devices (191.0.0.1 and 192.0.0.1). Which commands would create this configuration?
A.
router eigrp 190
redistribute static
!
ip route 0.0.0.0 0.0.0.0 Null0
B. ip default-network 20.0.0.0
C.
router eigrp 190
redistribute static
!
ip route 0.0.0.0 255.255.255.255 Null0
D. ip default-network 20.20.20.0
Answer: A
Question 8
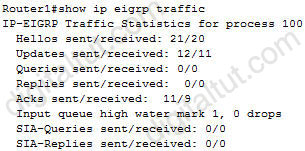
Which command will display EIGRP packets sent and received, as well as statistics on hello packets, updates, queries, replies, and acknowledgments?
A. debug eigrp packets
B. show ip eigrp traffic
C. debug ip eigrp
D. show ip eigrp interfaces
Answer: B
Explanation
Below is the output of the “show ip eigrp traffic” command:
Question 9
Which three statements are true about EIGRP operation? (Choose three)
A. When summarization is configured, the router will also create a route to null 0.
B. The summary route remains in the route table, even if there are no more specific routes to the network.
C. Summarization is configured on a per-interface level.
D. The maximum metric for the specific routes is used as the metric for the summary route.
E. Automatic summarization across major network boundaries is enabled by default.
Answer: A C E
Question 10
Which two statements about the EIGRP DUAL process are correct? (Choose two)
A. An EIGRP route will go active if there are no successors or feasible successors in the EIGRP topology table.
B. An EIGRP route will go passive if there are no successors in the EIGRP topology table.
C. DUAL will trigger an EIGRP query process while placing the flapping routes in the holddown state.
D. A feasible successor in the EIGRP topology table can become the successor only after all the query requests have been replied to.
E. The stuck in active state is caused when the wait for the query replies have timed out.
F. EIGRP queries are sent during the loading state in the EIGRP neighbor establishment process.
Answer: A E
Question 11
What are three key concepts that apply when configuring the EIGRP stub routing feature in a hub and spoke network? (Choose three)
A. A hub router prevents routes from being advertised to the remote router.
B. Only remote routers are configured as stubs.
C. Stub routers are not queried for routes.
D. Spoke routers connected to hub routers answer the route queries for the stub router.
E. A stub router should have only EIGRP hub routers as neighbors.
F. EIGRP stub routing should be used on hub routers only.
Answer: B C E